

Days on Market Plunge 24%. Inventory Tightens. Single-Family Holds Firm.
October 2026 data shows accelerating buyer velocity across Southwest Florida. Median days on market dropped 24.1% to 55 days, overall active inventory contracted 9.1%, single-family home prices held completely firm at $445,000, and condo contract demand rose as pricing adjusted.
October 2026 statistics for the entire Southwest Florida regional market, compared with October 2025. Source: Coconut Coast Organization of REALTORS®.
October 2026 demonstrated robust buyer transaction velocity across Southwest Florida. While monthly closed sales eased modestly by 4.6% compared with a year earlier, homes that sold spent significantly less time on the market, active inventory contracted by more than 2,300 properties, and single-family residential prices held rock solid.
The standout signal for October was the dramatic acceleration in marketing times. Region-wide, median days on market dropped 24.1%—from 72 days down to 55 days. Properties priced aligned with current market expectations are entering contract rapidly, dispelling concerns of an idle or stalling housing market heading into the peak winter tourist and seasonal residency period.
Equally important is the supply trajectory. Active residential inventory contracted 9.1% across the MLS to 23,475 homes, fueled by a 10.6% pullback in new listings (5,893 vs. 6,593 last October). Single-family home inventory tightened by 10.3% to 6.4 months of supply, while condominium inventory shrank 15.2% to 9.5 months of supply.
October 2026 Video Intelligence
Watch our dual regional video updates covering local market nuances across Southwest Florida, from the coastal corridors of Bonita Springs and Estero to the dynamic submarkets of Fort Myers and Naples.
Bonita Springs & Estero Market Update
October 2026 Trends • Prices +1% ($525.5K) • Inventory −20%Naples & Fort Myers Area Market Update
October 2026 Trends • Naples Price +6% ($620K) • Ft. Myers Sales SteadyThree Key Signals That Defined October
01 / Days on Market Plunge
Properties moved 17 days faster than last October, with median days on market falling from 72 to 55 days (−24.1%). Single-family homes transacted in just 49 days.
02 / Inventory Tightening
Active listings declined 9.1% across the region to 23,475 homes. A 10.6% drop in new listings kept supply lean and protected overall months supply at 11.6 months.
03 / Demand Absorption
Condominium pendings rose 3.3% as price corrections attracted buyers. Year-to-date regional closed sales climbed 7.0% (31,784 sales), driving $19.88B in volume (+12.6%).
Infographic 01: October Market Pulse & Velocity
Key metrics for October 2026 compared with October 2025 across Southwest Florida.
Source: Coconut Coast Organization of REALTORS®. Percentages represent Year-over-Year changes against October 2025.
Single-Family Homes vs. Condominiums
Southwest Florida's property types continued to perform along distinct tracks in October. Single-family homes proved exceptionally stable in price and supply, while the condominium market registered healthy contract gains as competitive pricing catalyzed buyer response.
Single-Family Homes
$445,000 0.0% YoY (Completely Stable)- Closed Sales
- 1,501 (−3.1%)
- Pending Sales
- 1,483 (−1.3%)
- Active Inventory
- 9,547 (−10.3%)
- Months of Supply
- 6.4 Months (Down from 7.1)
- Median Days on Market
- 49 Days (−24.6%)
Condominiums
$313,750 −10.4% YoY (Value Reset)- Closed Sales
- 616 (−8.3%)
- Pending Sales
- 722 (+3.3%)
- Active Inventory
- 5,853 (−15.2%)
- Months of Supply
- 9.5 Months (Down from 11.2)
- Median Days on Market
- 65 Days (−29.0%)
Infographic 02: Single-Family vs. Condominium Dynamics
October 2026 metrics for single-family residences and condominiums in Lee, Collier, and Hendry counties.
Median Sales Price
Months Supply of Inventory
Median Days on Market
Source: CCOR October 2026 Local Market Update for Lee, Collier & Hendry Counties.
October 2026 Figures, Side by Side
Detailed performance breakdown across all property classifications in Lee, Collier, and Hendry counties.
| Property Type | Closed Sales | Pending Sales | Median Price | Active Inventory | Months Supply | Median DOM |
|---|---|---|---|---|---|---|
| Single-Family Residence | 1,501 (−3.1%) | 1,483 (−1.3%) | $445,000 (0.0%) | 9,547 (−10.3%) | 6.4 Mos | 49 Days (−24.6%) |
| Condominium | 616 (−8.3%) | 722 (+3.3%) | $313,750 (−10.4%) | 5,853 (−15.2%) | 9.5 Mos | 65 Days (−29.0%) |
| Residential Income | 30 (−3.2%) | 32 (−28.9%) | $407,000 (−8.5%) | 456 (+24.3%) | 15.2 Mos | 41 Days (−10.9%) |
| Vacant Land | 387 (−4.2%) | 390 (−10.3%) | $40,000 (+9.6%) | 7,619 (−3.5%) | 19.7 Mos | 61 Days (−10.9%) |
Submarket Highlights: Bonita Springs, Estero, Naples & Fort Myers
Regional totals conceal meaningful micro-market differences across Southwest Florida's distinctive communities. Here is how our primary submarkets performed in October 2026:
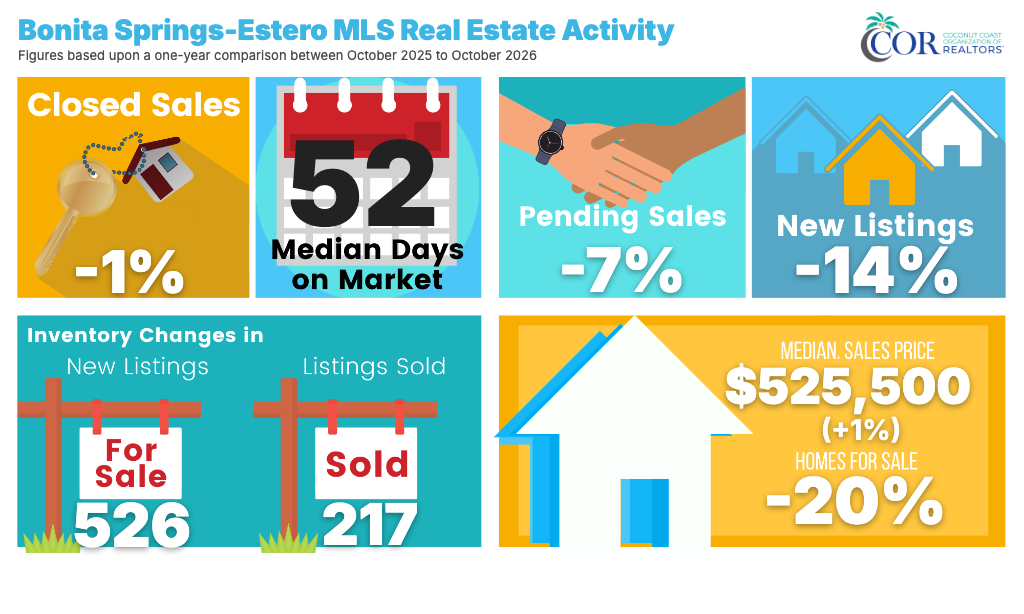
Bonita Springs-Estero: Held its position as a preferred lifestyle enclave, recording a 1% gain in median price to $525,500. Closed sales finished essentially unchanged at 217 transactions (−1%), while active inventory compressed a significant 20% year over year. Properties entered contract at an average pace of 52 days.
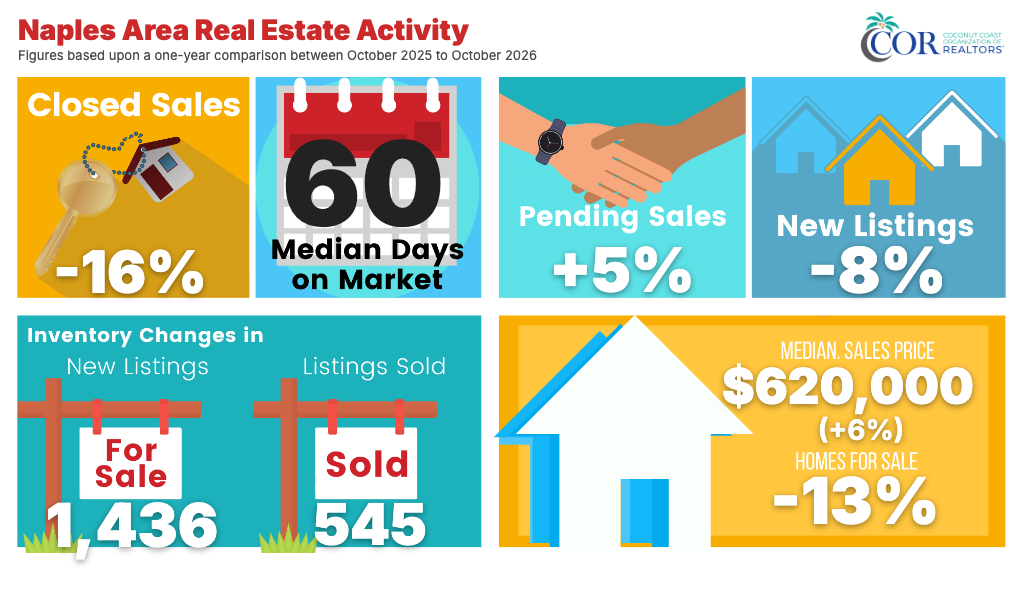
Naples Area: Continued to demonstrate luxury buyer purchasing power, with the median sales price climbing 6% to $620,000. Buyer interest strengthened with pending sales rising 5%, while inventory contracted 13%.
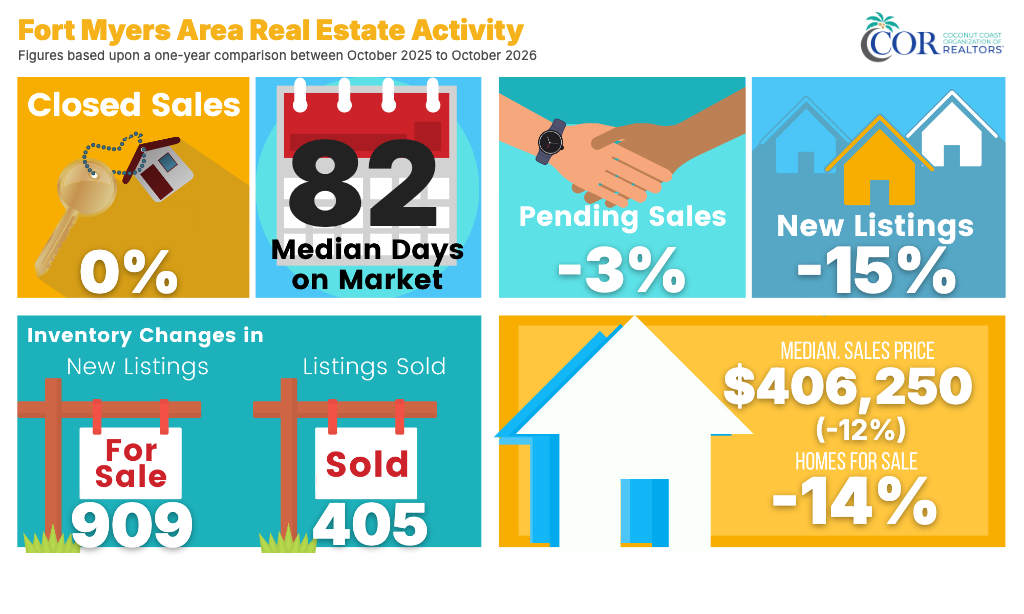
Fort Myers Area (including Fort Myers Beach): Recorded steady transaction consistency with 405 closed sales (0% change vs. October 2025). The median price adjusted to $406,250 (−12%), while inventory dropped 14%, offering balanced opportunities for buyers seeking primary and seasonal residences.
Year-to-Date Perspective: Sustained 2026 Market Strength
Examining the first ten months of 2026 confirms that Southwest Florida's real estate market has experienced a solid expansion in transaction volume and financial liquidity:
Consistent contract closings through spring, summer, and fall have kept cumulative 2026 sales substantially ahead of 2025 benchmarks.
Over $2.2 Billion in additional capital has flowed into Southwest Florida residential real estate this year, reflecting continuous demand.
What October Means for Buyers, Sellers, and REALTORS®
For Buyers
- Move promptly on well-priced homes: With days on market down to 55 days (and 49 days for single-family), desirable listings are not languishing.
- Explore condo value: A 10.4% median price adjustment creates exceptional purchasing power in maintenance-free coastal communities.
- Inventory is tighter than last year: With 9.1% fewer homes for sale, choice requires active engagement with your agent.
For Sellers
- Less competition: Inventory is down across all submarkets, reducing direct competing listings in your neighborhood.
- Price accurately from day one: The homes selling in under 50 days are those positioned precisely with recent comparable sales.
- Single-family resilience: Median single-family prices held at $445,000, signaling steady consumer equity and confidence.
For REALTORS®
- Highlight transaction speed: Use the 24.1% drop in DOM to motivate hesitant buyers and guide sellers away from overpricing.
- Leverage the condo rebound: Pending condo contracts are up 3.3% as buyers recognize compelling entry pricing.
- Prepare for winter seasonality: Lean inventory entering November and December positions Southwest Florida for an active winter peak.
Sources and Methodology
- Data Providers: Statistics compiled by Domus Analytics and Florida REALTORS® from the Southwest Florida MLS (SWFLAMLS) and CCOR regional records.
- Reporting Area: Headline MLS statistics represent the complete regional MLS database. Property-segment metrics represent Lee, Collier, and Hendry counties.
- Definitions: Median sales price represents the midpoint where half the homes sold for more and half for less. Days on Market (DOM) measures initial listing date to contract date. Months supply calculates current inventory divided by the 12-month average monthly sales rate.
- Footnote: Closed sales represent completed deed transfers recorded during October 2026. Pending sales indicate executed purchase agreements awaiting closing.
Access Complete October 2026 Market Reports
Download full statistical publications, property-type data tables, and high-resolution infographic visuals prepared by the Coconut Coast Organization of REALTORS®.