Data Timing Note
May 2026: Housing stats, active listings, consumer sentiment
April 2026: Airport passengers, unemployment, permits, coastal home sales
March 2026: Tourist tax revenues, taxable sales
Housing stats reflect May 2026. FGCU regional indicators use the latest available month by category.
May 2026 did not reverse the Southwest Florida market story. It sharpened it.
Across the region, demand continued to show up in the contract data, supply remained tighter than it was a year ago, and several local housing indicators pointed to a market that is still moving when properties are positioned correctly. At the same time, the latest regional economic indicators from FGCU show a broader economy sending more mixed signals, with softer taxable sales, higher unemployment, weaker consumer sentiment, and reduced building permit activity.
“The right read for May is not back to frenzy, and it is not market weakness.”
It is a selective housing market operating inside a softer regional economic backdrop.
Contracts Stayed Strong While Supply Tightened
The clearest housing signal in May was still contract activity.
In the regional single-family market, pending sales rose 36.1% year over year, while new listings fell 12.4%. Inventory was down 21.4%, and months of supply fell to 5.7. That is not the shape of a passive market. Buyers were still writing contracts, and available supply was lower than it was a year ago.
CCOR Fast Stats: May 2026
The market’s demand-and-supply dashboard for single-family and condos.
Single-Family Homes
| New Listings | 2,512 (-12.4%) |
|---|---|
| Pending Sales | 2,958 (+36.1%) |
| Closed Sales | 1,856 (-5.9%) |
| Median Sale Price | $440,000 (+4.8%) |
| Inventory | 10,588 (-21.4%) |
| Months of Supply | 5.7 Mo |
Condos / Townhomes
| New Listings | 1,139 (-1.8%) |
|---|---|
| Pending Sales | 1,419 (+56.3%) |
| Closed Sales | 1,024 (+14.3%) |
| Median Sale Price | $357,600 (-2.0%) |
| Inventory | 6,838 (-19.2%) |
| Months of Supply | 6.7 Mo |
At the same time, May was not a simple across-the-board acceleration. Single-family closed sales were down 5.9% year over year, even as the median sale price rose 4.8% to $440,000. That combination points to a market where demand is present but still disciplined.
Condos and townhomes showed even stronger transactional momentum. Pending sales rose 56.3%, closed sales rose 14.3%, inventory fell 19.2%, and months of supply dropped to 6.7. However, the median condo sale price slipped 2.0% to $357,600. That makes condos one of the more active segments by volume, but still price-sensitive.
Bonita Springs–Estero & Naples: Local Market Nuance
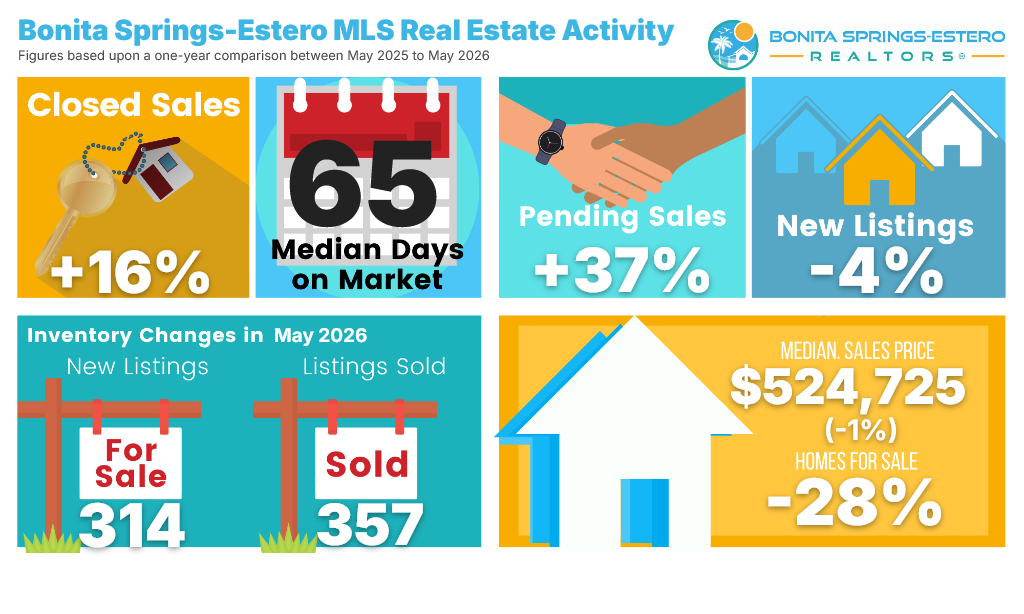
Bonita Springs–Estero remained one of the clearest examples of tightening local inventory in the supplied May data. Closed sales rose 16% year over year, pending sales rose 37%, and homes for sale were down 28%. The market added 314 new listings in May but sold 357 listings, meaning sales outpaced new supply during the month. That helps explain why available inventory continued to tighten compared to last year.
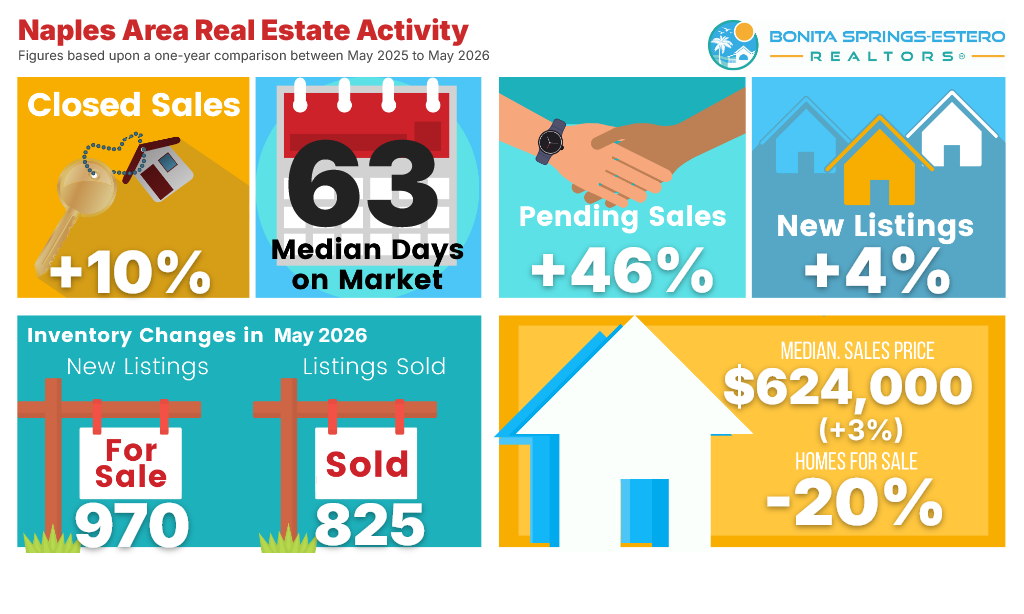
“Bonita/Estero looked tighter. Naples looked active with better replenishment.”
Naples also showed strong May demand, but with a slightly different shape. Closed sales rose 10%, pending sales rose 46%, and homes for sale were down 20% year over year. Median sale price increased 3% to $624,000, and median days on market came in at 63. The difference was supply flow. Naples added 970 new listings in May and sold 825 listings. That means Naples had strong demand, but it also had more new supply coming into the market than Bonita Springs–Estero. In practical terms, Naples looked active and healthier than last year, but slightly better replenished in real time.
Regional Indicators Show a Mixed Economy
The broader regional picture helps explain why pricing remains selective. Airport passenger activity for the region was down roughly 2% year over year in April, showing some cooling in travel volume. But tourist tax revenues improved roughly 9% in March, suggesting that lodging and visitor-related activity remained relatively resilient.
Taxable sales told a weaker story. Real taxable sales in the five-county region fell 13% year over year in March. That is one of the clearer signs that consumer spending has softened, even as housing demand has remained active.
Regional Economic Indicators: May 2026
Review the comprehensive FGCU Regional Economic Indicators dashboard and report.
Airport Passengers
Tourist Tax Revenues
Taxable Sales
Unemployment Rate
Coastal Employment
SF Building Permits
Coastal SF Sales
Res. Active Listings
Consumer Sentiment
The labor market also weakened. Southwest Florida’s unemployment rate rose to 5.8% in April, up 0.4 percentage points from March and up 1.6 percentage points from April 2025. Coastal-county employment was down 6,200 jobs year over year, with only a few sectors adding jobs.
Together, those indicators suggest that the region is not weak across the board, but it is uneven. Tourism is still showing resilience, housing contracts are still active, but consumer spending and employment conditions are more cautious.
Housing Fundamentals Look Firmer Than the Broader Economy
FGCU’s housing-side indicators were more constructive than several of the broader economic measures. Single-family home sales across the coastal counties increased 10.8% year over year in April, reaching 2,678 sales. At the same time, single-family building permits fell 20.1% year over year to 1,209. Active listings averaged 21,290 on a typical day in May, down 19.3% from May 2025.
“Housing looked firmer than the broader consumer economy.”
That gives us a clearer picture of where the market stands. Resale activity improved, active listings declined from last year, and future new-construction supply softened. But pricing still varied significantly by county and property type.
Pricing Stayed Local
Prediction Check: The 2026 Framework Still Holds
Earlier 2026 updates emphasized that Southwest Florida was becoming an active but selective market. The key recommendation was to watch pending sales against new listings, because that relationship would tell us more about future closings and inventory pressure than price headlines alone.
May largely supported that framework. Pending sales remained strong across the regional single-family market, the condo market, Bonita Springs–Estero, and Naples. Inventory was down year over year across major housing categories.
Active but selective market
Contracts stayed strong, but pricing was still disciplined.
Pendings vs. New Listings Lead
Pending sales outpaced new-listing flow in key segments.
Strong Pendings Lift Closings
Condos and local city graphics improved, but regional single-family closings were down.
The one area that deserves nuance is closed sales. The earlier expectation that strong pending sales would support closings held up for condos regionally and for the local Bonita Springs–Estero and Naples graphics. However, regional single-family closed sales were still down 5.9% year over year in May. So the demand thesis held, but it did not show up evenly across every segment at the same time.
What This Means for Buyers and Sellers
For buyers, May showed that opportunity still exists, but it is not evenly distributed. Inventory is lower than it was a year ago, and strong pending activity means well-positioned homes are still getting attention. But the broader economic backdrop gives buyers reason to stay disciplined.
“The homes that make sense relative to the market are still moving.”
For sellers, the message is still pricing accuracy over ambition. Demand is there. Contracts are happening. But the market is not strong enough to reward every listing regardless of price, condition, or competition. The homes that make sense relative to the market are still moving. The listings that overshoot the market are still likely to sit.
Bottom Line
May 2026 showed a housing market that kept absorbing inventory faster than the broader economy regained momentum. Contracts stayed strong, local demand remained active, and inventory continued to tighten from last year’s levels.
But the broader regional indicators remind us that this is not a runaway market. Consumer spending softened, unemployment rose, sentiment slipped, and building permits declined.
That is why the most accurate description remains the same: Southwest Florida is active, selective, and increasingly data-driven.