
CCOR Market Intelligence • July 2026
Inventory Tightened. Turnover Improved. Prices Split.
Across Bonita Springs, Estero, Naples and Fort Myers, July brought fewer homes for sale and lower months of supply than a year ago. But price movement ranged from a double-digit gain to modest declines—evidence that Southwest Florida is clearing more efficiently without becoming one uniform seller’s market.
Data Timing Note
Data current as of August 6, 2026. All data sourced directly from the Bonita Springs–Estero Board of REALTORS® MLS / Domus Analytics databases unless otherwise noted.
July 2026 continued the story CCOR has tracked since spring—but it also added an important correction. March showed pending sales outrunning new listings. May showed active contracts and tighter inventory. June showed more of those contracts converting into closed sales. July confirms that available stock compressed broadly across the region. What it does not confirm is a single regional price rebound.
Bonita Springs, Estero, Naples and Fort Myers all finished July with fewer homes for sale than in July 2025. Their reported months of supply also fell between 22.7% and 34.9%. Yet the reported price benchmark rose 11% in Estero and 2% in Naples, while it fell 2% in Bonita Springs and 1.5% in Fort Myers. That is the defining July result: tighter supply improved the market’s ability to move inventory, but pricing remained local, selective and sensitive to property mix.
“The July data proves two things at once: Southwest Florida was more efficient than a year ago, and it was still too segmented for one price headline to describe the whole market.”
What the July numbers prove
Every market carried fewer homes for sale than in July 2025.
The descriptive closed-sales-to-homes-for-sale ratio improved in all four markets.
Reported year-over-year price movement split evenly across the four markets.
The first result is straightforward: inventory compressed. The second result is more useful. By comparing July closed sales with July homes for sale, we can see whether the market converted more transactions relative to its available stock. This is not a formal MLS absorption-rate calculation and should not replace months of supply. It is a simple descriptive ratio created for this article to compare the same two measures consistently across markets and years.
Watch the July Regional Market Breakdown
Watch our latest market overview video for a quick visual summary of the July data before reviewing the detailed regional charts below.
- Inventory compressed across all four SWFL markets.
- Closed-sales-to-stock ratio improved region-wide.
- Local pricing trends remained highly split.
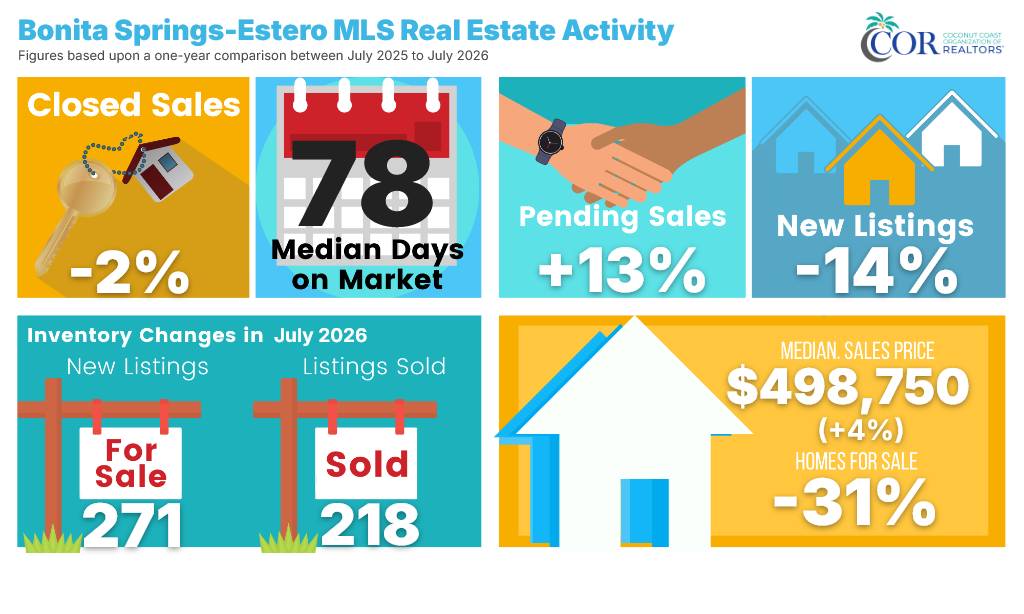
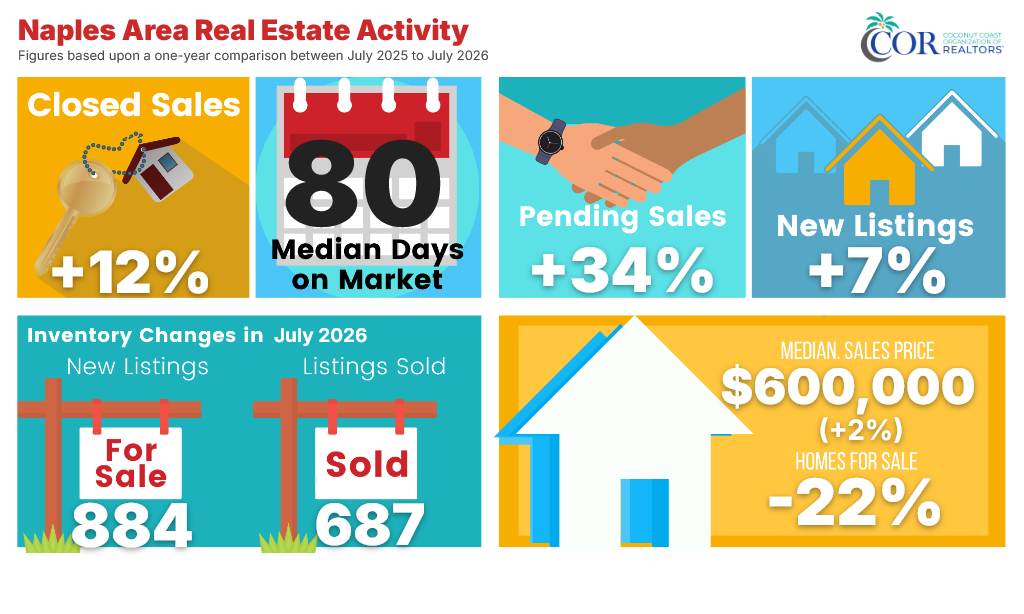
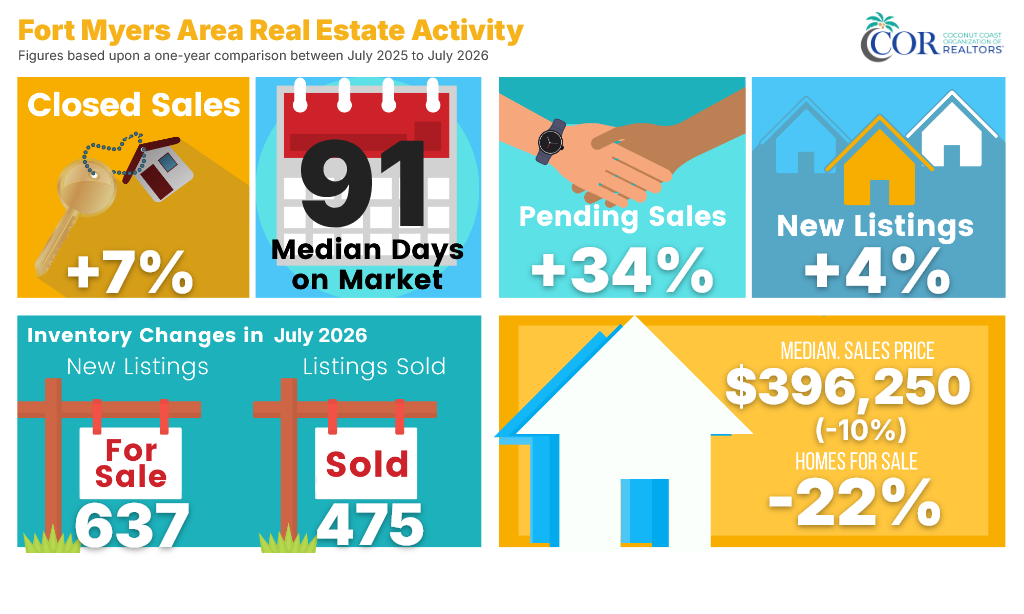
Bonita Springs recorded the largest inventory decline of the four markets, falling from 1,116 homes for sale in July 2025 to 756 in July 2026, a calculated decline of 32.3%. Estero fell from 667 to 469, down 29.7%. Naples declined from 5,328 to 4,156, down 22.0%, while Fort Myers declined from 3,827 to 3,010, down 21.3%.
The supplied months-of-supply figures tell the same story from a different angle. Bonita Springs stood at 6.1 months, down 34.9% year over year. Estero stood at 5.0 months, down 22.7%. Naples was at 6.0 months, down 30.8%, and Fort Myers was at 6.2 months, down 27.5%. The decline was not confined to one price tier or one county-side market. It was broad.
The market moved more efficiently—even where sales fell
Inventory decline by itself can be misleading. Listings can fall because homes sold, because fewer owners listed, because stale inventory expired or because the market moved between seasonal peaks. That is why July closed sales matter.
Bonita Springs closed 123 sales, up 3.4% from 119. Naples closed 687, up 12.1%. Fort Myers closed 482, up 8.6%. Estero was the exception on raw volume, with 95 closed sales compared with 104 a year earlier, down 8.7%.
But even in Estero, inventory fell much faster than sales. The result was a stronger relationship between transactions and available stock in every market.
Bonita Springs
Estero
Naples
Fort Myers
Bonita Springs’ ratio rose from 10.7% to 16.3%, an improvement of roughly 53%. Naples improved from 11.5% to 16.5%, about 44%. Fort Myers improved from 11.6% to 16.0%, about 38%. Estero improved from 15.6% to 20.3%, about 30%, despite recording fewer closings.
This supports a stronger conclusion than “there were fewer listings.” July’s market cleared more inventory relative to the stock available. Sellers still had competition, but the relationship between sales and supply was healthier than it was during July 2025’s inventory peak.
Tighter supply did not create uniform price growth
If Southwest Florida were operating as one undifferentiated market, broad inventory compression might be expected to push prices in the same direction. It did not.
Estero reported the strongest year-over-year price movement at approximately +11%, reaching $507,500. Naples rose about 2% to $600,000. Bonita Springs declined 2% to $490,000, and Fort Myers declined 1.5% to $336,000.
Estero’s combination—higher price benchmark, fewer closed sales and lower inventory—may reflect mix as much as broad appreciation. A small market can move sharply when the share of higher-priced or lower-priced properties changes from one month to the next. Naples’ modest increase alongside a 12% rise in closings is a more conventional “more activity with firm pricing” result. Bonita Springs and Fort Myers show that even when supply tightens and closings improve, buyers can remain price-sensitive.
That is why the July article cannot responsibly say “prices rose” or “prices fell” across Southwest Florida. Both statements would erase the most important information in the data.
Watch the Local Market Insights Breakdown
Watch our detailed video report for local market breakdowns across Bonita Springs, Estero, Naples, and Fort Myers.
- City-by-city price movement and supply absorption.
- Single-family vs. condo momentum comparison.
- Key takeaways for buyers, sellers, and REALTORS®.
July 2026 market comparison
| Market | Reported price | Price YoY | Homes for sale | Inventory YoY | Closed sales | Sales YoY | Months supply |
|---|---|---|---|---|---|---|---|
| Bonita Springs | $490,000 | -2.0% | 756 | -32.3% | 123 | +3.4% | 6.1 |
| Estero | $507,500 | +11.0% | 469 | -29.7% | 95 | -8.7% | 5.0 |
| Naples | $600,000 | +2.0% | 4,156 | -22.0% | 687 | +12.1% | 6.0 |
| Fort Myers | $336,000 | -1.5% | 3,010 | -21.3% | 482 | +8.6% | 6.2 |
Tighter than 2025 does not mean “back to 2022”
The most useful long-term check is the comparison with July 2022. All four markets carried substantially more months of supply in July 2026 than they did four years earlier. The supplied reports show Bonita Springs supply 95.2% above July 2022, Estero 158.9% above, Naples 60.4% above and Fort Myers 143.1% above.
At the same time, the July price benchmark remained below 2022 in Bonita Springs, Estero and Fort Myers. Naples was the only one of the four markets above its July 2022 benchmark.
This matters for both buyers and sellers. July 2026 was not a return to the scarcity conditions that characterized the earlier market. Buyers generally had more choice than in 2022, even after the year-over-year inventory decline. Sellers faced a better turnover environment than in 2025, but not a blank check on price.
How July extends the spring story
Pending sales rose faster than new listings, setting up inventory compression.
Inventory tightened while pricing remained disciplined and local.
More pending activity appeared in closed sales and regional inventory compressed.
All four markets improved sales relative to available stock, but prices split.
The earlier CCOR articles repeatedly described the market as active but selective. July strengthens that framework. Activity can improve without producing runaway price appreciation. Inventory can tighten without removing buyer leverage from every property. The market rewards listings that align with condition, location, product type and current competition.
Official July market visuals
What this means for the market
For buyers
Inventory is lower than last year, but supply remains well above 2022 levels. Buyers should not assume every listing will become a bidding contest. Compare recent closed sales, current competition, condition and time on market.
For sellers
The turnover environment improved, but price performance was mixed. A tighter market can help a correctly positioned listing; it does not automatically rescue an ambitious list price.
For REALTORS®
Lead with the micro-market. July’s regional pattern is useful, but the listing’s property type, community, price band and competition determine the practical strategy.
Bottom line
July 2026 was a broad inventory-compression month. Homes for sale declined in every market reviewed, months of supply fell across the board, and the relationship between closed sales and available stock improved everywhere.
But July was not a uniform price-growth month. Naples and Estero moved higher; Bonita Springs and Fort Myers moved lower. Even after the 2026 tightening, months of supply remained far above July 2022 levels.
The best description is not “hot” or “cold.” It is more efficient, less overstocked and still highly local.
Sources and methodology
- CCOR Fast Stats – July 2026.
- Florida Realtors® Monthly Indicators – July 2026.
- CCOR Market Reports archive.
- CCOR/Domus Analytics local July 2026 report decks for Bonita Springs, Estero, Naples and Fort Myers.
- March 2026 market update.
- May 2026 market update.
- June 2026 article: “Contracts Converted, Inventory Compressed, Local Markets Split.”
- Freddie Mac Primary Mortgage Market Survey, used only as general financing context. The latest result available during research showed the 30-year fixed rate in the mid-6% range.
Methodology: Year-over-year inventory and closed-sales percentages were calculated from the July 2025 and July 2026 counts displayed in the supplied local reports. The closed-sales-to-homes-for-sale ratio is an original descriptive comparison for this article and is not an official absorption-rate or months-of-supply measure. All price conclusions are limited to the reported monthly benchmark and should not be interpreted as an appraisal or forecast for an individual property.