
Data Timing Note
Data current as of July 8, 2026. All data sourced directly from the Bonita Springs–Estero Board of REALTORS® MLS / Domus Analytics databases unless otherwise noted.
June 2026 did not change the 2026 market story. It confirmed it.
For months, our articles have described Southwest Florida as active but selective: buyers were still writing contracts, sellers were no longer operating inside a scarcity-driven market, and pricing strength depended more on execution than on broad market heat. June is the clearest confirmation of that framework yet. Across Southwest Florida, closed sales rose 9.3% year over year, pending sales climbed 36.5%, median sale price across all property types increased 4.6%, and total inventory fell 17.1%. That is not the profile of a stalled market. It is the profile of a market that is moving, absorbing supply, and rewarding realistic positioning.
“The market is no longer just showing strength in contracts. In June, that strength showed up more clearly in closings.”
Watch the June Market Breakdown
For a quick video overview of the June numbers, watch our latest market breakdown before digging into the full segment-by-segment data below.
- Closed sales improved year over year.
- Pending sales remained one of the strongest lead indicators.
- Inventory continued to compress compared to June 2025.
The strongest June signal is that transaction strength broadened. In single-family, pending sales rose 35.6%, closed sales rose 3.7%, median days on market improved from 63 to 50, the median price increased to $449,000, inventory dropped to 9,780, and months of supply fell from 7 to 5. In condos, pending sales rose 40.5%, closed sales jumped 29.0%, days on market improved modestly, inventory fell 22.6%, and months of supply dropped from 10 to 6. Condos still look like the volume leader, but single-family showed a firmer pricing result in June.
Single-Family Homes
Tighter and FirmerCondos & Townhomes
Faster Transaction ReboundThat does not mean June was a one-note seller-market comeback. The selective side of the story is still visible in the details. Condo median price was only slightly positive year over year for June and remained down 5.1% on a year-to-date basis. Land and residential-income properties were more mixed, with softer year-to-date closing and pricing results and longer market times in some categories. Even the broader all-property dataset showed a healthier market, not a speculative one: days on market improved to 59, and percent of list price received rose to 94.8%, but the market still stopped short of the speed or pricing intensity associated with 2021-style conditions.
Single-Family
Tighter & FirmerCondo / TH
Volume ReboundVacant Land
Active, Slower ConvIncome Prop
Mixed & SensitiveLocal Markets Moved Together, But Not Identically
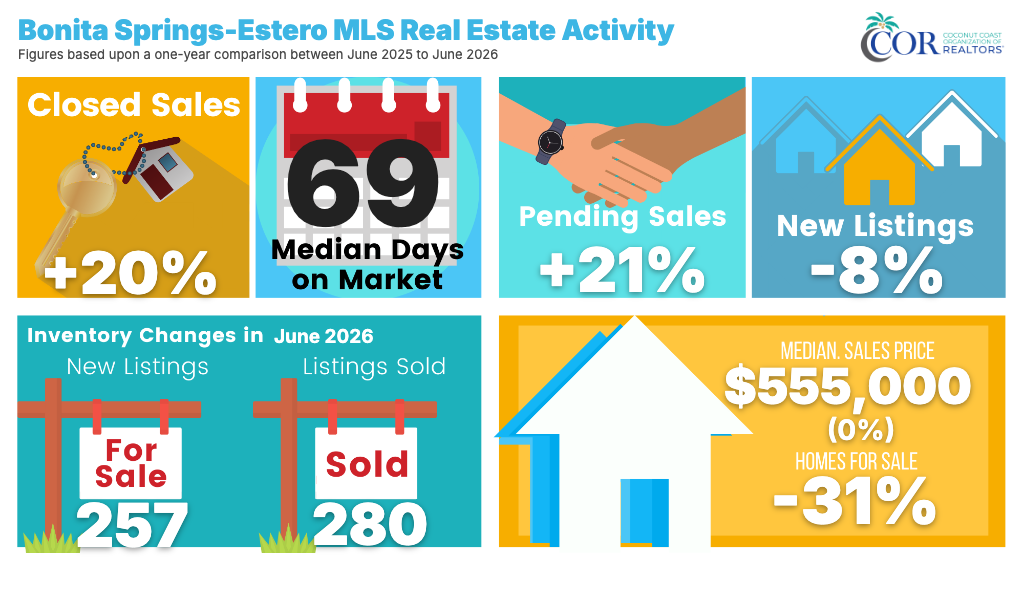
The local graphics make the June story easier to feel. In Bonita Springs–Estero, the June infographic shows closed sales up 20%, pending sales up 21%, new listings down 8%, and homes for sale down 31%. The market brought on 257 new listings and sold 280, which means the area absorbed slightly more than it added during the month. The median sale price came in at $555,000, flat year over year, and median days on market stood at 69. That is classic "tightening without frenzy" in our articles: strong local volume, less available supply, and pricing that is holding, not exploding.
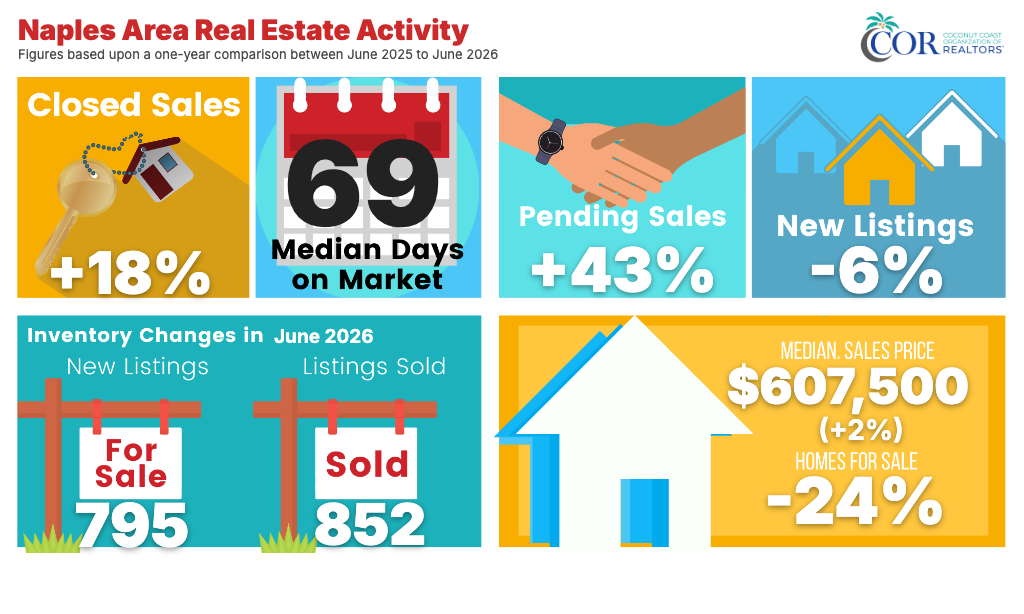
Naples looked strong as well, but with its own shape. The June Naples infographic shows closed sales up 18%, pending sales up 43%, new listings down 6%, and homes for sale down 24%. New listings totaled 795, while listings sold totaled 852, another sign that demand is still absorbing more than the market is adding. The median price was $607,500, up 2%, and median days on market were 69. Compared with our earlier 2026 commentary, June makes Naples look active and still relatively premium, but no longer meaningfully replenished in real time.
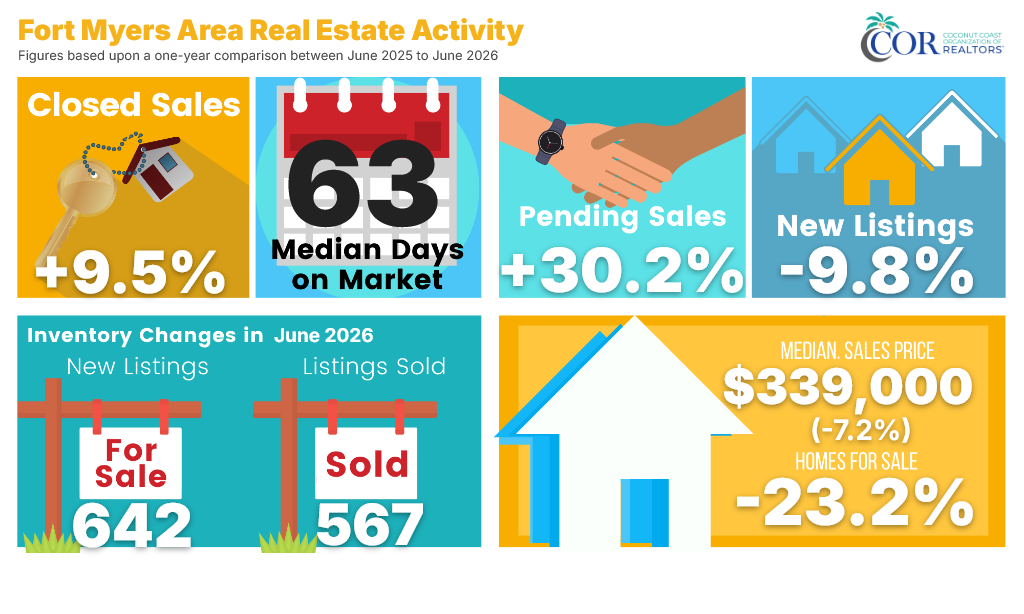
Fort Myers remained the most affordability-sensitive of the three city graphics. Its June infographic shows closed sales up 9.5% and pending sales up 30.2%, but the median sale price was $339,000, down 7.2% year over year. Homes for sale were down 23.2%, yet Fort Myers added 642 new listings and sold 567, meaning it did not absorb monthly inflow as completely as Bonita Springs–Estero or Naples did. That is important. It suggests Fort Myers is still participating in the region’s stronger transaction environment, but it is doing so with more price sensitivity and less immediate inventory drain.
Bonita Springs-Estero
Tighter, Steady PricingNaples
Strong Absorption, Premium StabilityFort Myers
Active, Price-SensitiveAbsorption Check: New Listings vs. Listings Sold
Bonita Springs–Estero and Naples both sold more listings than they added in June, helping explain the stronger inventory compression in those local markets. Fort Myers remained active, but it added more new supply than it sold, which supports the more price-sensitive reading in that market.
From May to June: Contract Strength Became Closing Strength
Reviewing the month-over-month trajectory from May 2026 to June 2026 highlights the market's broadening volume conversion.
Single-Family Homes Shift
Condos & Townhomes Shift
“June did not replace the May story. It moved it forward.”
For the Data-Minded Reader: Fast Stats Local Market Update Detail
Single-Family Fast Stats
| Metric | June 2025 | June 2026 | Change |
|---|---|---|---|
| New Listings | 1,037 | 917 | -11.6% |
| Pending Sales | 838 | 1,115 | +33.1% |
| Closed Sales | 839 | 895 | +6.7% |
| Days on Market | 69 | 61 | -11.6% |
| Median Price | $600,000 | $600,000 | 0.0% |
| Sold Dollar Vol. | $956.0M | $974.1M | +1.9% |
| % List Price Rec. | 93.90% | 95.20% | +1.4% |
| Inventory | 5,749 | 4,199 | -27.0% |
| Months Supply | 6.9 | 4.7 | -31.5% |
Condo Fast Stats
| Metric | June 2025 | June 2026 | Change |
|---|---|---|---|
| New Listings | 790 | 759 | -3.9% |
| Pending Sales | 681 | 938 | +37.7% |
| Closed Sales | 619 | 789 | +27.5% |
| Days on Market | 74 | 74 | 0.0% |
| Median Price | $360,000 | $350,000 | -2.8% |
| Sold Dollar Vol. | $321.2M | $451.9M | +40.7% |
| % List Price Rec. | 93.96% | 94.14% | +0.2% |
| Inventory | 6,192 | 4,765 | -23.0% |
| Months Supply | 10.0 | 6.0 | -39.6% |
Supporting Trends and Long-Term Structure
The June numbers also read especially well when placed against our earlier 2026 forecasts. January told readers to watch whether pendings would outrun new listings. February said the spring pipeline looked stronger if those contracts converted. March said the key pattern was “pendings up, listings down.” April argued that the market was absorbing rather than overheating, and May kept the same thesis while resisting either euphoric or negative exaggeration. June supports every major part of that sequence. It shows a market that is still selective but more broadly constructive than it looked at the start of the year.
Pending Sales Trend
Contracts remained one of the strongest indicators in June.
Closed Sales Trend
June showed clearer conversion from contract activity into completed sales.
Inventory of Homes for Sale
Available supply remained below last year’s level.
Months Supply of Inventory
Months of supply continues to normalize downward.
How the 2026 Thesis Held Up
Active but selective; watch pendings vs. new listings.
ConfirmedSpring pipeline strengthened.
ConfirmedPendings rose while supply tightened.
ConfirmedAbsorption, not overheating.
ConfirmedHousing active, broader economic backdrop mixed.
AdvancedClosings confirmed the housing-side thesis more broadly.
CurrentThe 2026 market thesis held: active, selective, and increasingly defined by absorption.
More June Market Context
For additional context on how these numbers translate into local conversations with buyers and sellers, watch the second June market video below.
The best one-line read for June is this: the market is no longer just promising stronger conditions through contracts; it is now showing them more clearly through closings as well. That matters because our readers do not need slogans. They need the operating truth. In June 2026, Southwest Florida looked more active, more absorbed, and still highly dependent on local pricing discipline, property type, and submarket positioning.
June's Bottom Line
“The market is moving, but it is still selective. Contracts stayed strong, closings improved, and inventory tightened—but pricing still depends on property type, location, and positioning.”